Arduino, ESP8266, HC-12 wireless, and WEMOS based Internet of Things projects.
Arduino graphical electric fence pulse monitor. Bar graph water meter display. Feature is a GPS track plotter with voive notes at POIs, all on an Arduino Due.
Arduino graphical electric fence pulse monitor. Bar graph water meter display. Feature is a GPS track plotter with voive notes at POIs, all on an Arduino Due.
Arduino and ESP8266 projects that connect with the Internet of Things. Including HC-12 wireless serial projects.
UPDATES: 25 Nov 2018 Arduino electric fence monitor now has a much improved graphical display, and further updates.
Add send simple alarm message using ESP8266 and smpt2go a/c, triggered on interrupt.
24 May 2020 Electric Fence Monitor, receiver end code, updated and released as PlatformIO project
20 May 2023 Electric Fence Monitor, complete rethink, simpler build, and a new 'dumb terminal'
7 Jun 2023 The big 'What If' when moving any project for third party use. A dissertation.
Using Cayenne IOT dashboard to remotely display flow sensor data at selected intervals via the ESP8266 based WEMOS D1.
Cayenne ( https://mydevices.com/) is a free, simple to use, and well documented way to enter the world of remote monitoring and control available on the "IOT" for those using the Arduino IDE.
All the programming difficulty is removed by available libraries, and the only technical info you need is your Wifi SSID and password! The file included a normal Arduino "ino", which flawlessly programs the WEMOS D1.
My only frustration is that, currently, the Cayenne dashboard has a limited selection of display "widgets". A larger selection is in the pipeline. In particular, there was no tag for "flow" so I had to label one gauge "volts" whilst displaying flow! The coming Text Box "widget" will be very useful.
The WEMOS D1 is not specifically listed on the Cayeene list of supported hardware, but the work-around is to choose the Arduino MEGA and add an ESP8266. Pay attention to the attached code, because the choice of "includes" needed to make the WEMOS D1 talk to the Cayenne dashboard is not as in per official Cayenne examples. My code includes some unnecessary features that were included so as to test Cayenne dashboard features, because this project was a first for me. The code contains comments on the correct use of 5v Hall Effect flow sensor and "Tiny RTC I2C Module" with the 3.3v WEMOS D1.
Project: Display water flow-meter data on Cayenne dashboard, sent via wifi connection from WEMOS D1
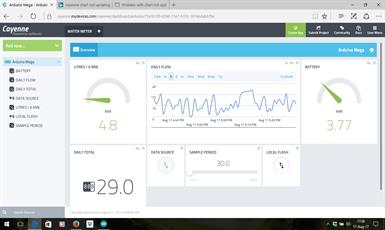

Above, the Cayenne Dashboard is plain but effective, and simple to build. Communication is two way, so although the monitoring project didn't really need them, I added features to just test the system. Gets an "A" in all areas I utilised, but I await the extra widgets now being prepared.
Above is the complete project designed to test the ability of the Cayenne dashboard to communicate with the WEMOS D1 The small breadboard contains a voltage divider, needed because the flow meter requires a 5v supply, and the WEMOS can only handle 3.3v inputs
The code provided for download is fully commented, and should answer all questions needed to replicate this build. with the Cayenne system, you must have the software loaded, with the allocated token added, and communication established, before you can build your dashboard. All too easy.
Using thinger.io dashboard to remotely display flow sensor data at selected intervals via the ESP8266 based WEMOS D1. (same flow-meter setup as illustrated above)
thinger.io ( https://thinger.io/) is free (with restrictions), easy to use, and a well documented way to enter the world of remote monitoring and control available on the "IOT" for those using the Arduino IDE.
The code for download is adapted from the Cayenne project code above, but modified to suit the methods used by thinger.io. You need to use C++11 Lambda functions, which are well explained in the Arduino documentation (http://docs.thinger.io/arduino/)
Two code versions are for download:-
This code is for a Dashboard setup that initiates requests data from the WEMOS D1 at intervals nominated when you set up each widget.
This download is for a dashboard set to receive data to a "bucket" as pushed at regular intervals by your WEMOS D1
In summary, coding is simple, and dashboard was easy to setup, the wigets being intuitive to use. The restrictions to the free version in no way restrict your ability to fully explore this platform. Another "A"!
Project: Display water flow-meter data on Thinger.io dashboard, sent via wifi connection from WEMOS D1

Left. The thinger.io dashboard allows for both display and control, and is easily built.
Project: Display sample data on Freeboard dashboard, sent via wifi connection from
WEMOS D1 to dweet.io and from there to Freeboard.
WEMOS D1 to dweet.io and from there to Freeboard.
A method of displaying your data and sending alerts. Simple, and will suit some projects.
Data is first sent to dweet.io (https://dweet.io/), then displayed on a Freeboard dashboard (https://freeboard.io/). This transfer is painless because dweet is linked already to Freeboard.
The free service is limited and public, but sufficient to let you explore the potential.
JSON formatted strings are needed, but easy to do. Code (use download button, left) sends simple random data, at 30 second intervals as displayed below.
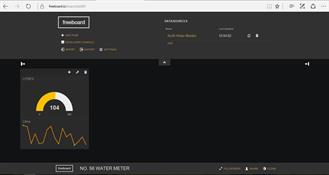
Left. Simple Freeboard dashboard, data sent from WEMOS D1
Project: Display sample data on Thingsboard dashboard, sent via wifi connection from WEMOS D1
Having successfully tested other free IOT dashboards, I turned my attention to the thingsboard.io platform. (https://thingsboard.io/) This is highly developed, and of professional quality in every way, with features way beyond my simple needs. Documentation is excellent, and your entry is clearly guided, step by step. If you go wrong following these instructions, take a deep breath and start again!
After an afternoon's frustration, no doubt caused by my inexperience, I only succeeded in getting my data to the dashboard, but got messages indicating that the 'wigits' on the example dash had probably been removed, despite being evident. On edit, they recognised the data sending device, but needed Time series keys, which should not be the case in the event of logins using "live demo server". Here I have retreated in defeat until I can gain a better understanding of what I have done wrong.
Most importantly, the code is proven. You can easily get WEMOS D1 to work with this system.
Despite my inexperience, thingsboard.io gets an "A+" all round.

Left: Thingsboard dashboard gets my data, but the other four widgets cannot find it.
Project: Water meter monitor with local display
A friend with a large garden and a number of discrete watering circuits was unhappy with timers that failed, and the corresponding need to check each line daily.
Rather than a sensor transmitting from each tap, the electronic timers were each given their own time block, and a single flow-meter was inserted just downstream of the service meter.
A single point check was all it took to verify every circuit had "fired"
Metering was in six minute blocks, from 6am to 10pm, and a single push button toggled display back for seven days, so "this day one week ago" could be compared"
Small board is RTC. Flow sensor is Chinese Hall Effect type, and magnetic pick up is external to water flow.


Above. Water flow meter uses a hall effect sensor
installed in line at exuit of service meter.
installed in line at exuit of service meter.
Local display gives consumption in 6 minute blocks, and can bring up a full week's data.
Project: Display sample data on IotTweet dashboard, sent via wifi connection from WEMOS D1
The IotTweet (https://www.iottweet.com/index.php) dashboard is simple, easy to use and free.
The attached software download shows you how to use the WEMOS D1 to send to, and receive data from, a very easy to set up dashboard. The dashboard can display text messages sent from your device. A quick, neat solution for simple monitor and control applications with a tiny learning curve. A neat feature is the ability to easily examine the incoming data stream.
The attached software download shows you how to use the WEMOS D1 to send to, and receive data from, a very easy to set up dashboard. The dashboard can display text messages sent from your device. A quick, neat solution for simple monitor and control applications with a tiny learning curve. A neat feature is the ability to easily examine the incoming data stream.

Project: RSSI indicator for ESP8266 WEMOS D1 with OLED display and "fiddling" the ESP8266 antenna.
This SSID and RSSI display is based on ESP8266 library code, so in that regard is nothing original. Its use is important to do two things:-.
Firstly, the 2.4 GHz signal from your access point varies in strength greatly depending on location and object reflections, including reflections from moving objects.
So, to get around this, proprietary products will use "dual diversity". In the simplest form, this means two antennas, with the unit drawing from the antenna with the strongest signal. Because your ESP8266 has only one pcb antenna, use this software to locate a position of strongest signal with least disturbances.
Secondly, even if you have no socket for attaching a gain antenna, you can fiddle, and may be able to to improve on the pcb antenna.
Cut two pieces of copper wire, one at 1/4 wave, and one at 5/8 wave (for 2400 MHz)
With plastic tweezers slide one end of the 1/4 wave piece along the pcb antenna, watching the RSSI. If you can find a position that improves your average gain by 3 dB (e.g, from -66 to -63 dB) then you have doubled your signal strength. Solder it in position quickly, with a tiny blob of solder. If no improvement with the 1/4 wave piece, try the 5/8 wave piece.
Remember, even if you can attach an external gain antenna, a lot are of dubious quality, and you should check your RSSI
Project: Sending data via WEMOS D1 ESP8266 to WEB DATABASE, back to EXCEL DASHBOARD
After finding how easy it is to use the the free IOT Dashboards on Dweet, Thingsboard, IOTTweet, and Cayeene, I found equally simple to send data to the cloud with Excel. This project demonstrates, and gives example code, showing how to post data to your website database, and how to get that back to Excel without using ODBC. The advantage in using Excel is that you have immense facility within Excel to build custom dashboards that exactly meet your needs, which I found was the feature lacking in the free IOT dashboards.
In this project, a WEMOS D1 (or other ESP8266 device) connects to your web database, and uploads data at fixed intervals.To achieve this, the WEMOS sends a POST request containing data, to the PHP server side script, which does the business with your database.
When requested Excel sends a POST request to another PHP script which sends our data back to Excel via an “echo”. Normally you would use Excel’s ODBC facility to make this a painless task, but my “budget” website sits on a Unix server which does not allow this. Hence, we have to use server side scripts, and do a little more work in Excel VBA to format the HTML stream that it receives. The bonus is that this method opens the possibility of easily feeding coded commands back to the ESP8266 (Filling the "echo" response back from the PHP scrip when data is uploaded, with a command string uploaded previously to the database per an Excel POST request.)
The coding is mySQL, not mySQLi as expected these days. I’m sure you can convert it.
Download file contains Excel, PHP, and Arduino files.


The benefit of using Excel instead of the publically available IOT dashboards is the level of control you have in formatting the display.

Flow sensor mounted in service line
Project: Arduino Graphical Electric Fence Monitor with wireless serial to Remote Graphical Display. LATEST REVISION May 2023
Farmers need a constant monitoring system for their electric fences. The liabilities brought about by an animal loose on a highway can be horrendous. Electric fencing is not only about keeping animals in! Fences often typically keep predators out, and cannot be off for even a short time. In Australia, where packs of feral dogs infest Crown Land, the cost of fence failure for those farming the public / private interface country has many times resulted in the destruction of a livelihood in a single night.
Here is what Iwas initially considered to be the basic “wish list” for an enterprise whose survival relies on fence integrity.
1. Continual monitoring, displayed at the homestead.
2. Audible or visual warning of common faults.
3. Monitoring that gives more information than fence volts or load.
4. As maintenance free as possible. Lightning resistant.
5. Using wireless modules to pass data to the reporting end. (No HV line to the house)
6. Holding a good waveform for the individual fence, for visual /mathematical
comparison with the current pulse.
7. Monitor or alert to phone. (Currently a warning per email via a free "smpt2go" a/c)
8. Cost minimal ( Option to use the home PC rather than a separate monitor)
9. Monitoring fire danger index (using Chandler
Burning Index) and modifying fault responses accordingly.
10. GPS moderation of RTC for remote outback stations
BUT, after six years of use, the complex 'bells and whistles' builds are abandoned. The new simpler builds still have everything needed.
I finally realised that a simple glance at the pulse pattern was all the farmer needed to find changes to his fence that needed investigating.
File packages are attached to allow you to replicate two versions:-
1. An Arduino based sender, and an Arduino based house display, using
HC-12 wireless units.
2. The sender can also be compiled in “stand-alone” mode as it also has its own display, but that defeats the purpose of having a fence monitor in the house.
Circuit and build details is in the accompanying pdf.
Those who still want all bells and whistles, the files are still here for builds #218, #219
Kitchen monitor displays fence pulse, with some simple analysis.
Sender unit out in the shed by fencer unit. HC-12 433 MHz serial transceiver sends data to homestead.
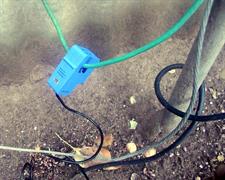
A current sensor on earth lead avoids all the problems of a HV pickup, and a large degree of lightning protection.

Electric fence monitor gives visual display of current pulse, Fence pulse is displayed with forward energy in yellow, reflected energy in blue.
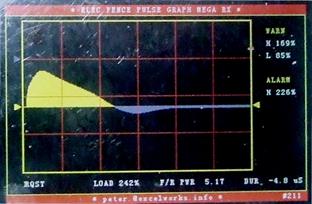
Above. The fence monitor clearly shows the change of pattern caused by rain when bottom wire is heavily 'grassed'. Pattern will return to normal as day dries out
Accompanying notes give examples of waveform under a variety of fault conditions
Accompanying notes give examples of waveform under a variety of fault conditions
Improved display now allows much easier visual assessment of fence operation
Fence monitor, Associated Project: Simple email alarm message via ESP8266 using smpt2go
Originally developed to email a simple warning that the electric fence had faulted, but the project has other uses, and can be further developed. Sends via your wi-fi connection, using the WEMO(S D1 (ESP8266)
Only integrates with the old (first generation) fence house monitor builds #218, #219 still available above
Message is sent when interrupt is tripped when a monitor pin goes low. Uses a free smpt2go account, which has a limit to frequency and total of messages, but entirely adequate for this use. Thank you to smpt2go for offering this access, and I commend these accounts for their ease of set up, and the obvious helpfulness of the smpt2go team. The smpt2go site has code to help Arduino users, but you may find this code easier to use, as it automates the Base64 conversions of user and password.
Project: GPS with screen track plot, voice notes at POI, csv log file, and grid bearings. Built for those who do field mapping with UTM map sheets. A unique design GPS with ability to make 'voice notes' for any POI
GPS logging can be paused, and clean glitch-free 8x8 audio voice notes made. The file-name is auto generated from the six figure coordinates and the last two digits of the log point.
Six figure coordinates here are as used by emergency services in Victoria, Australia, per instruction "To obtain the (six figure) reference, take the 2nd, 3rd, 4th numbers from the WGS84 Eastings, and the 3rd, 4th, 5th numbers from the WGS84 Northings." These are used in conjunction with a given map number.
Can be compiled with two display choices:-
1. UTM 1km Grid, with coordinates, on screen to match those on WGS84 maps. (Coordinates become visible when auto-scaling display expands to include a major 1 km gridline)
100m minor grids are plotted but not labelled. Set "DefaultMetresPerPixel" to 5.0, compile with "UTM_GridlinesWanted" set "true"
2. 'Local grid', working with 50m grids from start point, handy for detailed logging of a small historical site. Set "DefaultMetresPerPixel" to 1.0, compile with "UTM_GridlinesWanted" set "false"
Not coded for universal use, (Southern hemi only) but you can make code changes for northern hemisphere use, as outlined in notes in the Arduino code.
Platform is ARDUINO DUE running direct plug in TFT shield w/ TFT_HX8357B and SD, using "TFT_HX8357_Due" library by BODMER
Currently using "UBLOX GPS MODULE with Compass 7M" GPS module (Compass not used), and GY-951 9 DOF module compass, and BMP280 (Barometric Pressure Sensor)
This design is now in its twelfth build. Reading switches on DUE interrupts with their odd habits, especially when software SPI disconnects,
then reconnects them has been a challenge. Very occasional random interrupts occur, some interrupts do not seem to pick up on first button press. Ok for me, but probably an annoyance to you! Build thirteen will explore reading all switches placed on a resistor chain, via an adc on timer interrupt.

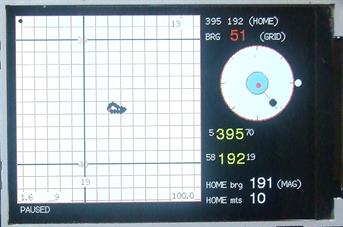
Above. Compiled in local grid mode, 1m per pixel, handy for mapping a small historic site. Compass has a fully constrained leveling bubble. Until level, the bearing is printed in red. I use tilt compensation, but find it never adequately compensates fully, so prefer to always use levelling bubble.
Upper left. This is what will go in your box! Keyes five button shield is used to offset the plot as desired. Other three buttons are stop/start toggle, pause/resume toggle, record/stop button. Without the extender, SD slots on these shields are very difficult to use.
Lower left. Compiled in UTM mode with 100m grid, with major 1km gridlines labeled, 5m per pixel. Plot corners give info on number of satellites, HDOP, current grid scale, plot point number, color of current point. Difficult to see in this pix, UTM grids are now labelled with coordinates
May 2023 update This file contains the new simpler builds, along with a pdf of Maker notes, and all the
explanations you should need. Also included is code for a new 'dumb terminal' which repeats the waveform sent by
the active TX / RX pair. Handy for the manager's house.
explanations you should need. Also included is code for a new 'dumb terminal' which repeats the waveform sent by
the active TX / RX pair. Handy for the manager's house.
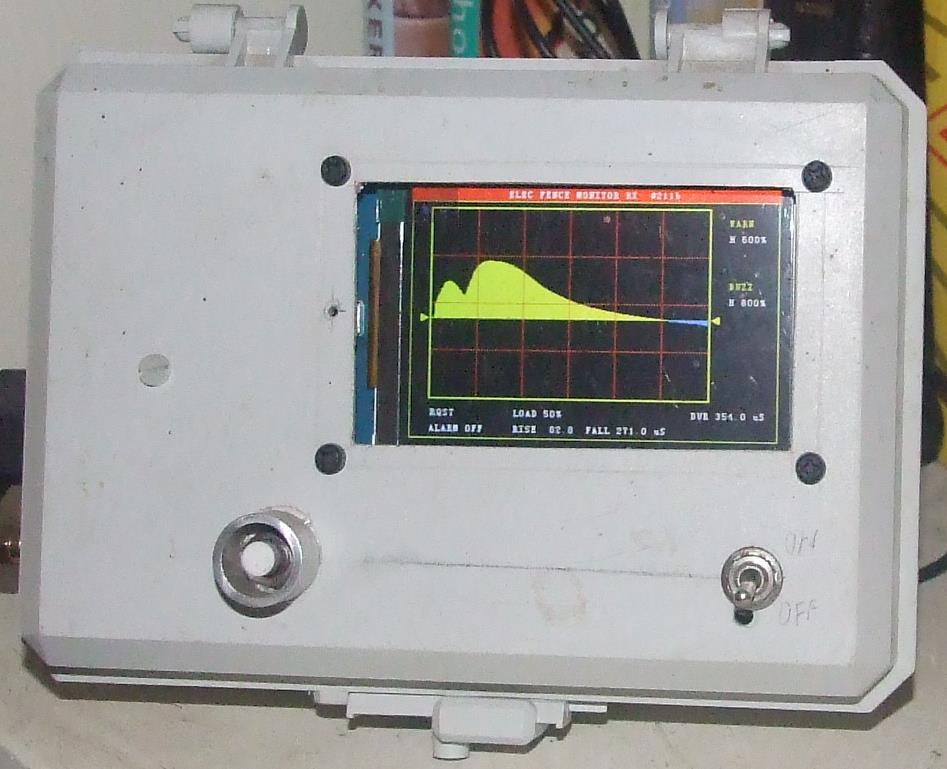

Left:. A typical spark fault. Possibly wires brushing, fence sagged so wires too close, or slug crawled over insulator
This project has run now for over six years without problem. The unit should be placed in the kitchen where it is constantly in view during the comings and goings of the day.
This is not a 'beginner' project
This is not a 'beginner' project

May 2023 update The legacy builds with all the bells and whistles are still available here for those so inclined.
May 2023 update Project documentation , your best starting point
A short dissertation. Advice to a young programmer. Some pitfalls!
Hey, Maker, don’t let your project become a ‘haymaker’!
The big, ‘WHAT IF’
As a member of the Maker Community, sooner or later a friend will talk you into build one of your sensational projects / system for their personal, or even commercial use.
Your ‘Killer Project’ may turn and destroy you.
Time to alert you to the most important project/programming concept, better known as the
‘What If’
The ‘What If’ will take more of your time than just programming the technology to do what you want.
If you don’t spend time dealing with the ‘What If’ at this stage, it will come back to bite you, forever.
When moving out from the protected environment of personal Maker expertise, you need to consider the Hostile Operator, the Hostile Environment, the Hostile Technology, the Hostile Programmer, and the possible need for Fail Safe and Downstream Protection and Traceability.
Your design for friend and his small business can become a nightmare of assistance calls, repeated explanations, service call backs if you simply try to drop your hobby project into a real world situation.