Arduino source code for bicycle derallieur, bicycle power meter, artificial horizon, temperature controller, motorcycle quickshift, Bluetooth interface to Excel, Bluetooth Keyboard to Arduino, Electric Fence Monitor, Arduino Octopus X/Y tester..
Arduino projects and Excel containing VBA code are included primarily for you to examine the code and use as a basis of your
own design. There are no step-by-step instructions here, not even good code, just unique and advanced Arduino projects..
YOU WILL ALSO FIND MANY Arduino/ESP266/ESP32 on the "IOT" and 'CURRENT' TAB.
23 May 2020 Updated Electric Fence Monitor on 'IOT' page, and now released as a PlatformIO project
10 Aug 2020 Automated control of the colloidal silver generation process
26 Aug 2020 A curve plotter for distributor centrifugal advance. Novel use of pulseIn().
10 Jun 2023 A large number of new projects, were added to CURRENT page
Arduino_To_Excel, real time display, using NETCOMM OCX.xls shows how to take Arduino data into Excel via Bluetooth. UPDATED project to use USB SHIELD and sCOMM32.OCX now lower on page
PicaxeToExcel.xls also uses NETCOMM OCX to take serial data into EXCEL, and is also applicable to Arduino. This project was to read automotive error codes
NETCOMM.OCX is (2023) avail at http://www.hardandsoftware.net/NETCommOCX.htm
NETCOMM.OCX is (2023) avail at http://www.hardandsoftware.net/NETCommOCX.htm
ELECTRONIC_DERAILLEUR.ino is the source code for my DIY electronic bicycle derailleur now
doing both front and rear. A simple joystick nudge initiates the changes. Not quite finished, but fully tested in bench mockup. Set of notes included.
doing both front and rear. A simple joystick nudge initiates the changes. Not quite finished, but fully tested in bench mockup. Set of notes included.
Here is the source code for a small temperature controlled resistor, used experimentally to destroy a skin growth, as an alternative to the barbaric uncontrolled burn caused by the typical surgery application of liquid nitrogen. Interest was generated by reading about slightly elevated temperatures used in prostate cancer treatment. A protocol, involving of a number of short sessions, each several days apart, with temperature set at a temperature researched to cause an appropriate burn was used. A "burn" was evident about ten days after three heat, and looked ugly for a few days, but growth is gone. (2025, now five years passed, still gone)
THIS IS NOT MEDICAL ADVICE, just a report of what I actually did! (Exact protocol is deliberately omitted.)
.DISCLAIMER. I am not a doctor. Seek medical treatment for any abnormal skin growths. Your life may depend on it. Burns may cause lasting skin damage. Burns are prone to infection. I do not reccommend you treat yourself. This download is from my lab notes, hand drawn schematic of how to drive the heating element from Arduino
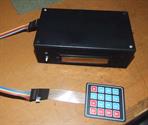
WeedMapper.ino was a custom build for a client whose task was to map weeds along Council roadsides. A custom GPS with a large 4x4 keypad was built, so the driver could record observed weeds without stopping. Keys 1-9 were used to nominate weed type, letters A-D were used to nominate patch size, After the recording drive, SD card was removed to an Excel application that processes, analyses, and reports.
Project: Import serial data via Bluetooth into Excel from Arduino
Project: Import serial data into Excel from Picaxe / AVR
Project: Electronic derailleur. Legacy only, was built before these became comercially available.
Project: Miniature controlled hotplate. (Several updates to this project, lower on page)
Project: Commercial WEED MAPPER using Arduino GPS and membrane keypad
SCREEN DESIGNER.xls is a spreadsheet template to assist the tedious problem of calculating button corner coordinates when designing a touch screen. Just place Excel rounded shapes over the simulated screen, and
read the coordinates to feed into your code.
read the coordinates to feed into your code.
Project: Button coordinates template

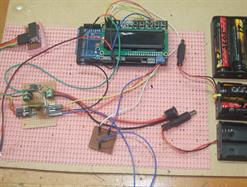
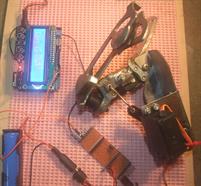
The use of a GPS as a bicycle power meter is explored in a file available on the Excel pages which you should look at first.. This concept is a reasonable one, but lacks in several ways. Firstly, the GPS height accuracy seems to increment or decrement in half metre steps. Secondly, wind velocity is not measured. This Arduino project uses GPS, but adds current tilt angle, barometric height increments of better accuracy (300mm), and accurate distance measurements from an optical wheel sensor, based on 4 pulses per revolution. Also logs to SD includes height and distance waypoints
Project: A bicycle power meter using mass, velocity and grade, with other factors, to calculate energy expended
My code allows optional selection of "bang-bang" or two PID options (proportional control) of temperature from the keypad, and would also form a useful basis for a temperature controlled microscope stage, or incubator.
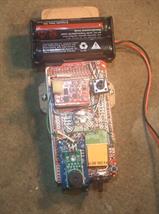

Above left: First prototype sits on the bicycle's Garmin CSX60 mount. Has GPS module, GY-80 9DOF sensor mounted to Arduino Mega, as well as an optical wheel revolution sensor calculating four times per revolution. The BMP085 lib used was from https://github.com/vieiraf/bmp085driver
Above right: Final model uses a TinyGps shield mounted to Mega, a start/stop button, and a button provided to add a marker tag to current location so sectors can be identified for analysis. Elusive though, is an effective and simple method of measuring wind velocity. The LCD is only for development purposes, as all info needed by the rider is conveyed by beeps,
Above right: Final model uses a TinyGps shield mounted to Mega, a start/stop button, and a button provided to add a marker tag to current location so sectors can be identified for analysis. Elusive though, is an effective and simple method of measuring wind velocity. The LCD is only for development purposes, as all info needed by the rider is conveyed by beeps,
The artifical horizon is based on a common 9DOF sensor, the GY-80. Arduino Mega is used on account of calculation overheads involved in the filtering. Display is on a common 320x240 LCD. Choose in software whether to display as a traditional aircraft Artificial Horizon, or as a running graph displaying pitch and roll separately.
This program has value for those as frustrated as I in trying to code workable filters. The GY-80 9DOF board is mounted (insulated of course) on a small brass plate which sits on a foam block, with hair sized wires to a connector block. This helps to give the system some inertia, and avoids those small vibrations directly affecting the sensor which was originally used on my bicycle power computer. A small piece of foam on top of the barometric sensor stops air disturbances causing gross flutter in altitude measurements
This program has value for those as frustrated as I in trying to code workable filters. The GY-80 9DOF board is mounted (insulated of course) on a small brass plate which sits on a foam block, with hair sized wires to a connector block. This helps to give the system some inertia, and avoids those small vibrations directly affecting the sensor which was originally used on my bicycle power computer. A small piece of foam on top of the barometric sensor stops air disturbances causing gross flutter in altitude measurements
Project: Arduino artificial horizon on 320x240 display

Project: Exploring accuracy limits to BMP180 atmospheric sensor
In developing the bicycle energy meter, I needed to improve the height accuracy returned by the GPS module. This Arduino sketch was used to explore the accuracy of the BMP180 sensor. Final comment is that huge oversampling, averaging, and filtering allows you to measure very small, < 30 cm, movements in the short term, but general atmospheric fluctuations overwhelm in the longer term. If used with tilt angle, distance wheel, and for five second time blocks, it gives higher accuracy than the GPS in this application.
The test program display below is simultaneously plotting a number of traces, all filtered differently, but you can comment out the surplus traces at will.
The test program display below is simultaneously plotting a number of traces, all filtered differently, but you can comment out the surplus traces at will.

Project: Arduino compass, experiments in tilt compensation
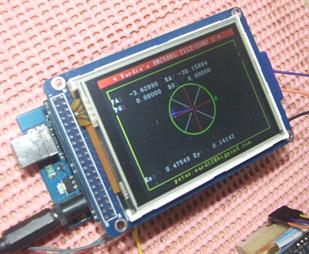
Building a compass with tilt compensation has not proved easy, but was essential for a bicycle computer. My Garmin CSX60 fails badly when tilted, so I investigated before incorporating into my bicycle computer.
This code may need tweaking, but the graphing routines may assist in other projects.
After trying many algorithms, effective tilt compensation sems restricted to +/- 40 deg.
This code may need tweaking, but the graphing routines may assist in other projects.
After trying many algorithms, effective tilt compensation sems restricted to +/- 40 deg.
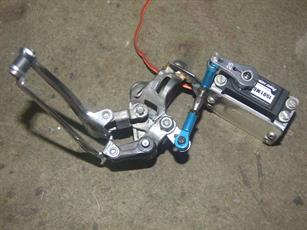
Now incorporated into a final software for integrated front and rear derailleur (above) Built and tested on a bench mockup, ready for component assembly into a neatly mounted control box, and on the road test. Six speed proto.
Project: Electronic front derailleur. Legacy project only.

Adapted from code found on the internet, to display on 320x240 display.
Project: Source code to find used i2c address'
A micro switch detects shift start, kills ignition for a chosen time (milliseconds) allows for push through shifting. Built by Swarfman64, software by self.
If you like motorcycle projects, take a look at Swarfman64's motorcycle dyno. http://swarfman64.blogspot.com.au/2015/01/motorcycle-inertia-dyno.html
If you like motorcycle projects, take a look at Swarfman64's motorcycle dyno. http://swarfman64.blogspot.com.au/2015/01/motorcycle-inertia-dyno.html
Project: Source code for motorcycle Quickshift
My personallibrary of Quick C functions. They will need adapting to Arduino use, as you will already find I have already done for use in the above artificial horizon and compass projects. The benefit in these functions is that they can be sized to suit your project without re-thinking the maths and coordinates. At the moment "getPixel" function is not available in Arduino TFT's, which makes several functions that avoid plotting over 'scope gridlines difficult to implement.(The importance of not plotting over gridlines is that you don't have to re-plot the background lines at each start of new trace.
Project: LEGACY ONLY. DOS Source code for oscilloscopes, meters, and polar plots that may be adapted for Arduino use.
"ARDUINO_DUE_AUDIO_RECORDER_8K_8BIT" is a voice audio recorder for Arduino Due. It requires none of the normal calculations associated with timer use, or fast read techniques. This code was originally integrated with a custom build GPS, for recording brief voice notes on demand at points of interest.
Filenames were derived from six figure GPS coordinates, plus waypoint number, but for this public release, a simple sequential filename, eg "WAV002.wav" is auto generated for each press of the start button. The code incorporates portions of Darren Yates "DigitalAudioRecorder" code, with acknowledgement.
"8x8" format gives totally adequate audio for the intended use. A fast read version (1.5 uS per conversion) is also included, and also needs no timer or interrupt calculations.
Finally, a program, "DUE_FAST_ANALOG_READ" is included to investigatee adc reading speeds of the DUE, including the fast read technique used above.
You will discover ta simple "#define SMP_RATE 950000UL" declaration drops all normal adc conversions (12, 10, 8 bit) from 4.3 to 2.8 uS. In 'free run' mode as used in "ARDUINO_DUE_AUDIO_RECORDER_8K_8BIT_FASTRUN," conversions take 1.5 uS. A mystery is that in earlier research, I found conversions closer to 1 uS
Project: Arduino Due Audio Recorder. 8k and 8bit, suitable for voice note taking.
This screen capture shows the DOS use of functions in the above download to produce a 400x200 screen with moveable cursors and grids. Source code for these is included, not for project use, but so you can lift the functions for the graphics display and cursors.
The program used a shareware menu library called "SMPLUS" which has disappeared from the internet, which makes it harder if you wanted to use the whole code as the basis for another DOS project. You can download my copy of Michael Yam's "SMPLUS" here, but all the original conditions of the Shareware license would still apply. It was freely useable, but registered users (paid) had access to the source code.
The program used a shareware menu library called "SMPLUS" which has disappeared from the internet, which makes it harder if you wanted to use the whole code as the basis for another DOS project. You can download my copy of Michael Yam's "SMPLUS" here, but all the original conditions of the Shareware license would still apply. It was freely useable, but registered users (paid) had access to the source code.
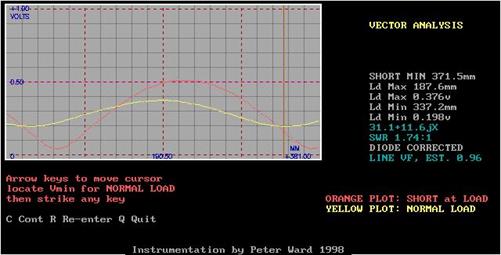
Again, an old DOS project but contains some useful routines. This project arose from difficulties with a number of 27 MHz irrigator controls in a large vegetable production area, and a way sought to monitor which irrigators were operating at a given time. The circuit below was used taking signal from the ICOM R7000 audio, and was followed by a RS232 to ttl level converter. Effectively a time slicer.Circuit snap from my lab. Diary. Some more detail in RF4.XLS, sheet 45.
Project: Read and display a code from 27 MHz transmitter, in 'C'

Left: Sweep was from the HP805 slotted line, more detail on Antenna page. Now that 480x320 displays are available for the Arduino, the graphing and cursor functions will be adaptable, but the lack of a "getpixel" function means other "work arounds" are needed to avoid plotting over gridlines. See "A resizeable Oscilloscope Display"later on this page, particularly the V.2 code.
Example codes featuring a resizeable grid for your 'scope. Handy where you don't want to use the entire screen for the display, as in the case where you need to display a line of text, report etc. Handy because you do not have to recalculate coordinates when changing size, or plot area. Displays do not write over gridlines, avoiding the need to re-plot the grid after each sweep. (Results on Mega were too slow for a free running 'scope, but may have other uses, such as showing a triggered sweep.)
05 Aug 2017. Examples added using BODMER library, much faster than UTFT. The "NUPLOT" headed files use a slightly faster technique to avoid need for grid re-draws
05 Aug 2017. Examples added using BODMER library, much faster than UTFT. The "NUPLOT" headed files use a slightly faster technique to avoid need for grid re-draws
Project: A resizeable Oscilloscope Display to fit on 320x240 or 480x320 screen for Arduino
It doesn't take long to discover the difficulty of getting combinations of shields to work together, especially UNO shields with SD cards,on the Mega.
Here is a successful integration of the Arduino Mega, with a LCD Keypad shield and a DEEK ROBOT
datalogging shield with SD and Real Time Clock. The SD card creates a new file and logs with a time stamp.
Now, this program doesn't do anything except log the key pressed with a time/date stamp. It was solely designed to prove that this combination would work together. Use it for the bones of your own program.
You MUST solder headers to the datalogger SDA and SCL holes, and join with wires to the Mega's SDA and SCL connections
Project: Get Arduino Mega 2650, LCD Keypad, and Datalogger shield ( with SD and RTC) all working together
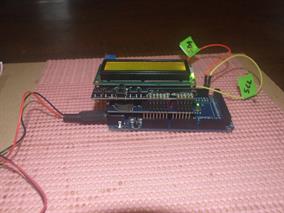
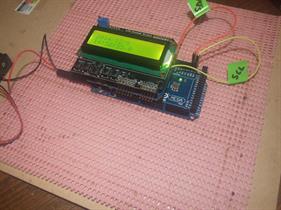
An upgrade to the temperature controller project to include logging with date and time stamp, using a DEEK ROBOT data logging shield between the Arduino Mega and the LCD Keypad.
Project: Upgrade the temperature controller to include Datalogger shield ( with SD and RTC) An extension of the previous project, "Get a MEGA 2650, LCD Keypad, and Datalogger shield ( with SD and RTC) all working together."
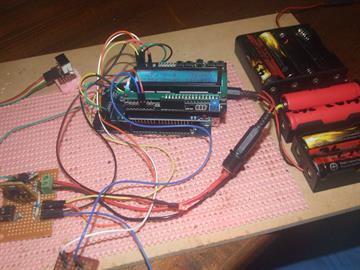
Servo driven DIY electronic derailleur, rear. The large LCD display is for development purposes only. Features joystick change. Nudge forward / back for rear, side to side for chain ring. Buttons to jog trim if needed, and all settings are remembered at bootup. Defaults can be easily restored.
Fully tested on bench mockup, now being suitably assembled for mounting on a frame and test ride! Unfortunately, for six speed, but easily extended. The reason for the pause in project is I intend to abandon servos and use steppers or mini servos as far more reliable and more finely controllable as need for ten speed.
Fully tested on bench mockup, now being suitably assembled for mounting on a frame and test ride! Unfortunately, for six speed, but easily extended. The reason for the pause in project is I intend to abandon servos and use steppers or mini servos as far more reliable and more finely controllable as need for ten speed.
Skin growth, before.
Skin growth, fifth week, now gone.
Temperature controlled hot plate, upper left.
Arduino weed mapper for mapping roadside weed counts "on the fly."
Arduino bicycle power meter, prototype
Arduino bicycle power meter, final form.
Arduino artificial horizon uses GY-80 9DOF sensor board.
GY-80 9DOF board on inertia mount to reduce vibration. Electrical connections of the finest copper wire.
Multiple traces of BMP180 atmospheric sensor.
Left: Arduino tilt compensated compass.
Arduino driven servo powered front derailleur. Final linkage design is in PDF notes associated with ino downloads.
Left: Data slicer circuit used to read 27 MHz transmitter codes
Arduino Mega 2650 matched with datalogging shield and 16x2 LCD keypad.
Arduino temperature controlled mini-hotplate now includes datalogging.
First, you need to verify your stepper driver is working correctly, and that the running direction is as wanted, so this is my separate program for the purpose.
Uses the 16x2 Keypad shield, atop of a DEEK ROBOT datalogging shield V1.0, sitting on a Mega2650, (because this was the basis of the original complete project)
Uses the 16x2 Keypad shield, atop of a DEEK ROBOT datalogging shield V1.0, sitting on a Mega2650, (because this was the basis of the original complete project)
Project: An algorithm controlled, stepper driven, tracking solar panel. No matter what the weather, never loses the sun!
Part 1. Checking the steppers, a separate program is used.
Part 1. Checking the steppers, a separate program is used.
The software lets you set max and min angle limits for panel movement. Reality is that it is very difficult to set up a full dawn to dark tracker mechanism, and the most important hours to track are about four hours each side of zenith. Restricted tracking is essential for those using simple lever linkages that have a limited movement.
.Panel must be initially set facing north, and tilted at 45 deg. On startup, the sun position calculator will tell the program where it needs to go on the basis of time given by the real-time-clock. You will need your Lat / Lon entered in the code, found from Google Earth. You will need to modify codes to suit the way your linkages
move the panel.
Part 2 The software.
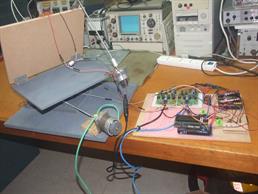
Test panel rotator connected to arduino. No safety stops are included in software. With a ton of experience with steppers, I can say that lost steps are possible, but with a correctly sized motor on screw threads, it won't happen.
Final build used TB6560 driver boards, in full step mode. Use of datalogging shield with SD allows logging any data you wish to include, but to make this shield work on the Mega you will need to jumper the shield's SCL and SDA to the Mega SCL and SDA pins. Also, to use the SD you need the Adafruit SD library, that allows pin nomination at setup.
This project was a bit of fun, but of no real use, except as another candidate for a Pyranometer project!
Just tracks the sun using the micro pan/tilt mount that is available cheaply. Uses the Motor Driver Shield V1.0 mounted on a UNO to run the provided servos. These are 180 deg. servos, so tracking is limited.
Just tracks the sun using the micro pan/tilt mount that is available cheaply. Uses the Motor Driver Shield V1.0 mounted on a UNO to run the provided servos. These are 180 deg. servos, so tracking is limited.

Arduino test bed for setting up your steppers. The solar tracking projects are set for Southern Hemisphere. In my setup, Azimuth moves from East to West with anti-clockwise motor rotation. Panel elevation angle increases using clockwise rotation. Your setup may be different.
CAUTION: Using a unit such as this on the road may be unsafe,as it DOES NOT incorporate any "fail-safe" features.
This Arduino Multi Purpose Shield is useful in concept, but lets you down badly in one major area if you wish to use it for more than an experimenter's learning platform.
Driving four seven segment displays with only two 74HC595's means multi digit displays cannot be permanently latched, consequently processor time has to be used to constantly cycle through segments to give an illusion of a permanent display. As soon as you need to do anything else you need to blank the display and go off to your next function call. (If you do not blank the display, you are left with the last displayed single digit latched, which is messy and confusing.)
The Arduino sketch download shows a simple temperature controller with the Dallas chip read on timer interrupt, with novel use of the on-board pot to set temperature limits "on the fly", and a very useful function to display a floating point number, passed directly, without the usual trickery of breaking it into digits and displaying as ints.


Project: Finding a useful purpose for this "experimenter's" 'MULTI PURPOSE SHIELD'
Project: Updated "Arduino to Excel", real time, using USB Shield and Bluetooth dongle
A neat arrangement to get and display real time in Excel. This version uses a USB shield on an UNO, with a LCD4884 keypad display shield stacked on top. This now uses a never-expiring trial copy of COMM32.OCX, which self installs and registers. It has a tiny unobtrusive nag screen, but works flawlessly. Not an "advanced" project by any means, just a dummy to prove that shield combinations work properly together. Whilst the communication is "two way", once Excel is logging, you have to stop logging to make changes to the data going back to the Arduino (in this case temperature set-point and fan speed) Just a concept project
NETCOMM.OCX is (2023) avail at http://www.hardandsoftware.net/NETCommOCX.htm
NETCOMM.OCX is (2023) avail at http://www.hardandsoftware.net/NETCommOCX.htm


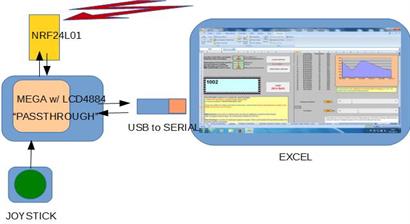
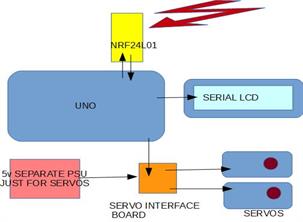
Project: "Arduino wireless to Excel", real time, using USB to TTL adapter and Mega as serial passthrough and remote joystick controller.
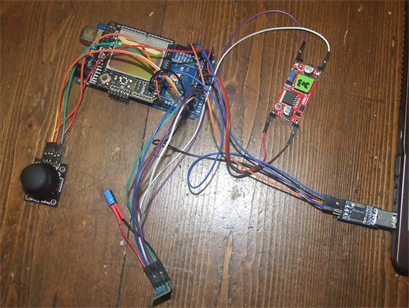
A project to log data wirelessly direct to Excel from a remote Arduino. Data comes to Excel via a serial pass-through beside the logging computer. This pass-through Arduino uses a joystick to position two servos on the remote Arduino to point a sensor providing the data.
Excel logs sensor data to a running display, as well as making a log to a separate worksheet. Passthrough Mega is all powered from USB port, but a separate 3.3v converter (from 5v USB power) drives the NRF24L01. Port current is about 140mA. DO NOT TAKE 3.3v from Mega for the wireless module!
NETCOMM.OCX is(2023) avail at http://www.hardandsoftware.net/NETCommOCX.htm

Project: Moving bar, multi-channel, RSSI display based on an ESP8266 chip
As always, it's wise to get a complex project going one step at a time. Here is a WiFi RSSI indicator, the basis of a project for the future relating to RF exposure.
What was to be a simple horizontal bar-graph with one bar allocated for each channel, became complicated when I realized there were several networks broadcasting on the same channel. Accordingly, the design was revised to list each unique network's RSSI bar in order down the page.
So, this is something to be incorporated into your own project. I'm sure the code could be tidied.

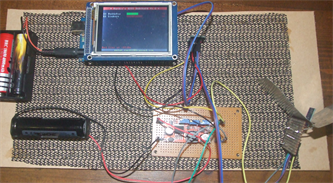
Note the mounting of the ESP8266 in a "corner reflector." Currently, this is NOT a fully scaled and designed antenna, as the corner reflector on my antenna pages is,and actually was to send the radiation away from yours truly as he sat for hours debugging this project.However, I am working on including this as a finished design, which may help improve a link range.(Because I recommend circular polarization for links, I am also putting my mind as to how this module could be adapted to drive a CP antenna.)
A separate power supply is used for the module , but actually the RSSI feature works with the module drawing power as a bleed from the level shifter, with no power connected.Should not happen, but does. (And will cook the shifter if the module is used in full power tx mode without the external supply to the ESP8266).
A separate power supply is used for the module , but actually the RSSI feature works with the module drawing power as a bleed from the level shifter, with no power connected.Should not happen, but does. (And will cook the shifter if the module is used in full power tx mode without the external supply to the ESP8266).
Project: Use Bluetooth keyboard to change variables in an Arduino program, or enter a password.
This code was for a project where I wanted to be able to change the values of several variables in my PID temperature controller at startup, saving endless recompiles of the sketch.
The Bluetooth-HID library examples proved a challenge, but a few hacks in the code here allow numerical variables in your program to be re-set without recompiling, and you will see where a slight modification in the filter will allow any ascii codes to be passed.
Features:
I have set the input routine to accept numeric keys, and decimal dot, only.
"Enter" or "OK" accepts your input, or loads a default if no numeric entries are made.
"DEL" erases all entered digits ready for a new set.
"BACK" just erases the last digit ready for new entry.
You can easily change the range of ascii input, which may be handy for a Security Code
I have stripped my temperature controller sketch of all working code except for that needed to demo how to use the bluetooth keyboard input, and put it here for an example.
The project uses a USB shield atop a Mega (Freaduino), piggy-backed with a LCD4884 shield. Combination is good, but is incompatible with an additional data-logging Shield with RTC which I wanted to add
Bluetooth keyboard used was model "RT_MWK08," which I believe to be the same as the "Rii mini i8." The keyboard has a mouse pad, but I have only concerned myself with the keyboard inputs. The keyboard worked "out of the box" with supplied dongle, and no pairing code was needed.

Project: All Arduino, self contained Logic Analyzer with accurate timing and readouts
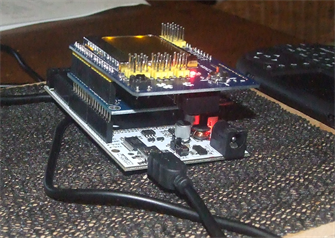
This All Arduino Logic Analyzer is a basic but self contained eight channel logic analyzer, with a 320x240 display based on Arduino Mega. It will not replace the commercial units that are so cheap these days, but is handy to over 3mbs, and is .
Currently, using a SY-TFT240 320x240 LCD, and taking data through PORT C. (An attempt to port to a Mega with larger 320x240 shield is not successful so far, because the larger shield uses PORT C, and PORT L does not seem to trigger reliably.)
Operation is simple. Press a button until you see the "armed" light, and wait for a trigger. On trigger and capture, display loops on captured data, giving opportunity to scroll across data, and shift cursor.
As presented this Analyzer takes 1500 samples after triggering, and you can slide the 320 pixel display window across the full dataset. (You could increase samples to use more of the Mega's memory easily.) To make this repetitive code easy to write, a VBA function for Microsoft Excel is commented at the bottom of the "ino," which you paste into the VBA developer section of Excel. Modify it for any size block of code you need.
A cursor can slid across the display, set by a pot value, and "uS from trigger" is displayed, giving the opportunity to do some reasonably accurate measurements. Even a commercial quality pot gives jitter, and I suggest a 10 turn pot be used for setting the cursor. Cursor implementation is rather crude, as it is redrawn at every screen draw. It is done this way because of lack of GetPixel in the graphics lib, which would enable you to write functions to move a cursor across an existing plot without disturbing what was already on the screen.
Operating in "fast mode,/unrolled loop" (no delay between reads), 3.1 Mbps is achieved.
An alternative operating mode is available with inter-read display choices of 1, 2, 4,8,16 or 32 uS. Although this uses "nops" per "__builtin_avr_delay_cycles(n)" there is still a loop time overhead, which is taken into account for on calling delays, cursor, and "offset from trigger" displays.
Graphing and checking the equation of the line shows a fixed loop overhead of 0.758 uS per loop. Simply put, when you normally "dial in" a 1uS inter-read delay to your code (16 clocks) , you actually get actually 1.758 uS between reads.
(Note:you need IDE 1.5.8 or higher to use true microsecond delays using "__builtin_avr_delay_cycles(n)" mentioned below)
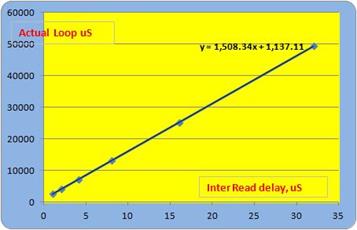

Saving trace data in a loop, even with the "nops" method of
"__builtin_avr_delay_cycles(n)," involves a time overhead.
The graph checks loop times for 1, 2, 4, 8, 16, and 32 uS inter-read delays over a 1500 read cycle.
The delays are spot on, as you would expect from a "nop" based on a crystal clock, and there is a time overhead for the loop of 1137 us for the 1500 reads. This is effectively 0.758 uS per read. As the loop overhead is close to 12.1 clock cycles, and in fact must be an exact integer, when we request 4 uS delay (16 clock cycles, we actually feed 48 minus12 =36 cycles to the delay function, "__builtin_avr_delay_cycles(n)")
Likewise for a true 1uS loop you need 16-12 = 4 cycles to be used in the delay loop. Unfortunately nothing will compensate for interrupts borrowing processor cycles!
Using this technique, you can compensate for any regular loop.
.
Unrolled loop operation takes 472 uS for 1500 loops. About 0.315 uS per read
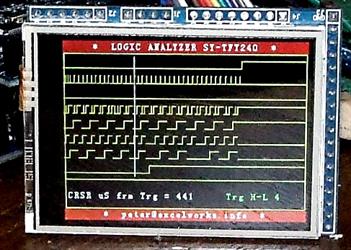
Left. Logic Analyzer, using all eight channels showing an arduino "Z80 emulator" drive to an obsolete Toshiba T6795 20x2 display driver. Project is to replace failed pedant LCD's on industrial welding robots, with modern LCD's. Conversion difficulty arises because the drives need both address' and data set for each letter before clocking.This info has to be taken from the bus, and adapted to drive a modern display.
The number "4" in bottom right corner indicates a 4uS inter read delay was selected,
The number "4" in bottom right corner indicates a 4uS inter read delay was selected,
Left: All Arduino Logic Analyzer uses latest Arduino function avail in IDE 1.5.8,
"__builtin_avr_delay_cycles(n)," to get closer to true microsecond timings in loops (explained later).
Inspired by the work of Andrew Gillham,
but quite different.
https://github.com/gillham/logic_analyzer
"__builtin_avr_delay_cycles(n)," to get closer to true microsecond timings in loops (explained later).
Inspired by the work of Andrew Gillham,
but quite different.
https://github.com/gillham/logic_analyzer
Project: A second variation of Temperature controlled miniature "Hot Plate"
The final design of my project to study removal of skin growths with controlled heat. A project that you should not replicate, even under medical supervision. This version allows parameter change via keypad, gives an indicative graph, stores the run to SD, and uses the RTC to give a timestamp..
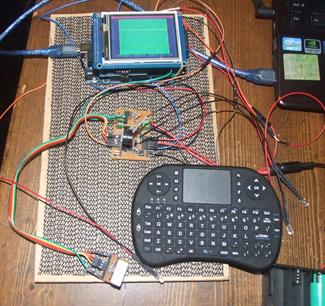

Again, in summary: This project is for investigating various thermal protocols for removing skin growths with "spot heat".
This program controls a small heated pad, which is held on the growth, providing heat surges at intervals.
Intention is to have sufficient heat to kill growth, without causing permanent skin damage (As in 2nd or 3rd degree burns!)
My current protocol uses a series of "temperature burst" treatments, two days apart, and results in a "burn" appearing about a week after treatment finishes..
This program is offered as an example of integrating and using Arduino components, especially the HID keyboard. IT IS NOT AN INVITATION TO TRY TO BURN SKIN GROWTHS YOURSELF. IT IS IN NO WAY MEDICAL ADVICE, and is to be considered simply a report of what I have done.
DISCLAIMER: The default values within the program are unproven, may result in serous burns. Burning off your own skin growths is irresponsible and dangerous.
DISCLAIMER: Seek medical advice for treatment of any skin growths, your life may depend on it.
DICSCLAIMER: Any burn also carries risk of infection
DISCLAIMER: Actual heat transferred to your skin depends on thermal mass and properties of the heat pad, tracking of the heat sensor, pressure of application and other factors unexplored here (including ambient temperature, heater battery voltage and PID ramp profile)
# Bluetooth Keyboard is used to input parameters to the Mega, saving rebuilds, and is based on a quick hack of the example Bluetooth code in Usb-host 2 lib
# The HID used seems to need a firm, slightly longer press than the usual keyboard "peck," something to get used to
#I hacked the HID example without trying to fully understand how this library functions. (Just so many hours in one day!)
# USB shield uses 9,10 and MOSI, MISO, SCK, SS (which are 51,50,52,53 on MEGA, 11, 12, 13, 10 on UNO)
# REM When "warming up" LED goes off, and"ready" led comes on, Start switch then has to be pressed long enough to catch end of the current loop,
# The graphical display is not sampled on an exact interval, and is indicative only. (The SD records the exact time, and should be extracted to Excel for analysis)
# SD record starts with a true date-time stamp, then continues with a millisecond count from timer, which starts when Arduino is turned on.
#heater element currently is a 0.5 ohm ceramic resistor, battery pack is 2 x 3.7v (nominal) li-ion cells that actually charge to 4.2v
#TO DO: Battery supply needs replacing with constant voltage power supply for consistent and repeatable "heat doses"
# Uploading code with battery attached may cause overheating during upload, and before safety shutdown can begin, as some pins have an on state during this procedure
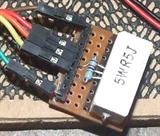
Left: Miniature hot plate is a 0.5 ohm ceramic resistor, with Dallas sensor thermally bonded to underside.
Project: Precision Micro Seed Metering head and Controller software with mini keyboard control.
Above: Precision Micro Seed Metering head.
A seed metering head for seeds less than one millimetre in diameter, but easily modified for seeds up to 2mm. Originally designed to "upgrade" the normal, hand pushed, two wheeled garden planter with belts or disks to handle fine seeds, it could mount on any existing planter where tiny seeds are traditionally distributed by air manifolds. In this case, a single unit is used for each row. Software accommodates this greater use, and with an eye on the broadacre needs of licensed poppy growers, a logging facility is inbuilt.
The metering is done by a tiny screw auger controlled by a stepper motor, with feed rate determined by ground speed.
I devised this system many years ago to plant minute kikuyu seeds into drought bared paddocks from the back of a motorbike. A tube ran to a small chisel peg in front of the rear wheel. It was then driven by a modified windscreen wiper motor, and was a great success.
Normal GPS speed is too inaccurate for use here for controlling feed rate, and would need to use a local correction signal. Such signals are readily available in many vegetable growing districts, but in many cases is subscription based, so I kept with a traditional method - a reflective sensor on the rear pressure wheel. I believe a magnetic pick up would be a better choice and final model will be so modified.
The software is based on the Mega 2650, with USB shield, and a 320 x 240 display on Sainsmart shield sitting on top of USB shield. Stepper is driven by EASY A3967 stepper driver board and expects a normal 200 step per rev. stepper,operating in single step mode.
Speed is determined via an IR sensor needing 4 reflective strips equally around a wheel, ie, triggers each quarter revolution. I have now changed from using interrupt here, to using a separate Uno to do the RPM of the sensor wheel and feed it to the Mega via i2c.Basically, the interrupt based sensor was compromised by the millis() function calls and resulted in erratic speed variations
An IR sensor is used to determine when hopper is empty.
Software allows calibration for new seeds, and remembers last settings. A wireless keyboard is used to enter all parameters to the Arduino. The released software also contains functions for building a record file, but this feature is not implemented, although all needed functions are in place.
The spring/auger used in this project is 8mm x 4.5mm x 300mm available on Ebay. It is joined to the stepper using a piece of flexible cable, which just now is a piece of bicycle brake cable. I intend replacing it with fine piano wire because the cable wind is opposite to what is needed and would unwrap under stress. The design of the hopper and outer tube allows quick substitution of larger seed tube and auger spring assemblies.
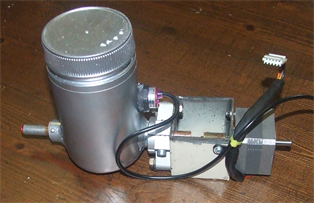
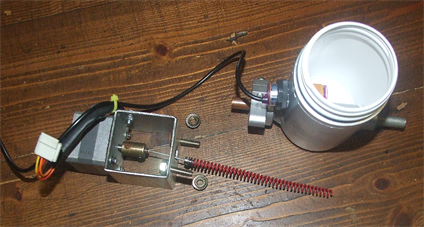

Left: Disassembled, showing auger attached by flexible drive., Diameter is chosen for a snug fit in feed tube, and whole assembly can be quickly changed. Not in place is the blackened paper located in the seed hopper, facing the IR sensor. Without this, the sensor always triggers off the reflective wall. Final build now uses a separate Uno to calculate speed and uses i2c to send to the Mega shown.
This project is complete, each function tested, now undertaking final build and field testing.
This project is complete, each function tested, now undertaking final build and field testing.
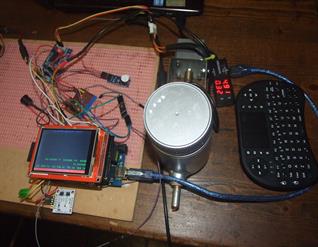
WARNING. EXAMPLES on THIS PAGE MAY CONTAIN CRAPPY CODE.
* Very occasional use of "GOTO?" GUILTY.
* Directly accessing global vars from functions unnecessarily? GUILTY
* Non standard bracket use? GUILTY
* Mixing global and passed vars in functions? GUILTY.
* Simplistic code,eg. "if( Wanted == 1)" instead of "if(Wanted)?" GUILTY
* Lazy repeats of code that could be wrapped into a single function? GUILTY
* Using "void" functions accessing globals instead of typed function return? GUILTY
* Inconsistent / non-standard use of #DEFINEs" GUILTY
* Failure to declare function prototypes" GUILTY
* Failure to clean code, leaving unused vars. and functions? GUILTY
* Mixing coding styles within a program? GUILTY
* Mixing styles of variable declarations e.g., "myBuff" "MyBuff" "mybuff?" GUILTY
* Thoughtless choices of types. e.g., "int" where "unsigned" would be better? GUILTY
* Too much in-line code instead of building with discrete functions? VERY GUILTY
* Inconsistent grouping of related variable declarations? GUILTY
* Using libraries for timer related tasks instead of manual calcs? GUILTY
* Not bothering with simple, evident, optimisations of code? GUILTY
* Putting up this stuff without bothering to clean it up? GUILTY
Project: Developmental code platform for Arduino DUE with scaled graphical displays and working SD
The Arduino DUE has given many a difficult time in getting the SD working. I needed to get everything checked out prior to porting some pet projects to the faster platform. Here tested on CTE shield and WOMARTS 320x240 display
Surprisingly, the SD on the "CTE TFT LCD/SD shield for DUE," V1.04 worked first up after soldering "J8"
Surprisingly, the SD on the "CTE TFT LCD/SD shield for DUE," V1.04 worked first up after soldering "J8"
I designed the base platform code so the graphical display could be instantly scaled to whatever size was required without any extra coding, and simply requires declaring the sizes as required, and top corner x/y. Now, this makes for slower code, but is handy in a lot of circumstances

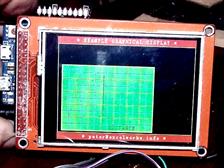
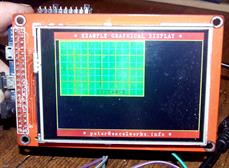
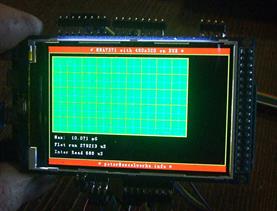
Illustrating the ease of positioning and sizing the graphical display, which includes a moveable cursor option..
Code snippet below is all you need to change within the program to resize the display (values below for right hand illustration). :
const int HeaderAndFooterBar = 16; //width wanted for header and Footer bar, suit text size chosen
//set TOP LEFT corners of graph area
int x_locus =12;
int y_locus = HeaderAndFooterBar + 4 ; // Actually a 2 pixel frame is plotted OUTSIDE this area, allow for it
//Set to the actual scope screen gridded display area to suit your need
//REM: WIDTH should be such that Width/2 lies on a Gridline IF adding a crosshair.
const int X_Wide = 280; //actual pixel width width chosen for plotted display.
const int Y_Wide = 200; //depth of display.
//Nominate the gridline spacing. NOTE THE REQUIREMENTS, re. multiples
const int X_MajorDivPixelsApart = 40; // These should be a multiple of DisplayGridPixelsApart, set below
const int Y_MajorDivPixelsApart = 40; //These should be a multiple of DisplayGridPixelsApart, set next
const int DisplayGridPixelsApart = 20;
Project: Use the GY-951 9DOF in serial mode. A promise that failed to deliver!
Unfortunately the great concept of an on board processor doing all the calculations of a 9DOF sensor, ready for a simple serial transfer, appears to fail in as much as I could not reach the suggested max update rates, and also some packets were truncated until I increased the Arduino Serial Buffer size.
The GY-951 appears to be a clone of the Sparkfun RAZOR offering, and the "Razor_AHRS" code is offered as suitable for this device.
Being averse to the complexity of the Razor_AHRS code, I set out to test the device in pure serial mode.
I was successful in getting Yaw Pitch and Roll as clean text packets in both "free run" and "packet on request" mode, and on both UNO and MEGA.
Example code is attached, which successfully captures the text stream, parses, and returns float values for Yaw, Pitch and Roll. Very handy, but.....,
I was not successful in getting a faster "packet on demand" throughput than 35ms before packets became corrupted, even though the docs suggest 20ms was the minimum needed.
In "free run" mode, I achieved 25ms throughput before corruption, disappointing but useful in quite a few applications. The example code can be simplified,(eg, packet check can be dispensed with) but the parsing code may help somebody
If using the commands for packets of all axis text ("#osct" - Output calibrated sensor data of all nine axes in text format and "#osrt" - raw sensor data of all nine axes in text format.) my code outputs a "PACKET FAULT" message yet displays the incoming stream correctly. This is because the parser is only set to detect and parse the basic X Y Z streams. You can modify it yourself.
I could not get complete packet sets in these modes until I increased the Arduino Serial Buffer size (I used 256) Instructions are freely available on the net to simply do this.

GY-951
Project: A 480x320 LCD plus SD, on Arduino DUE, displaying MMA7361 data
Finding shields, board, and library combinations that are compatible is often difficult.
Here is a combination that you may have overlooked, and the LCD plugs directly into the DUE without an intermediate board. In this example the DUE reads MMA7361 data on analog port,does calcs and scaling, erases old data point, and plots fresh data point in << 1ms. The SD works too!
The 480x360 LCD, advertised for the MEGA at AU$13, gives a great performance on the DUE. You will have to find and download the UTFT lib that is modified for its HX8357B driver
http://www.ebay.com.au/itm/3-2-TFT-Color-Screen-Module-320-x480-LCD-Screen-Support-Arduino-Mega2560-1PCS-/371221517748?hash=item566e86d5b4
Because the SPI pins needed by the SD are placed differently on the DUE, you will need to download the Adafruit SD library, a drop in replacement for the standard SD lib, but allows you to nominate SPI pins. Note that this module has no touch functions.
This example is a stripped down code from a MMA7361 design for single plane balancing, included just to show how easily everything works together, not a completed project. It uses the MMA7361, without a library.
Note, 2023. SD lib from Adafruit is no longer avail. Arduino SD does not support SPI on any pin. I include the old lib needed in my PlatformIO projects
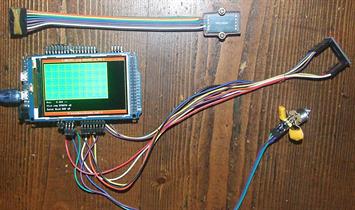
Final version, as currently bench tested
plus plenty of notes to help you build
plus plenty of notes to help you build
An altenative code for the electronic derailleur, using the joystick both for indexed changes and jogging. This code drives a 1.3" OLED as a better daylight alternative to the LCD shown above, and much lighter for the envisioned final port to the Arduino Nano.
UPDATE Nov 27 2015 Once logging starts, you normally cannot change initial values. Code shows how to change values sent from Excel whilst logging proceeds
Project: Arduino temperature controlled miniature "hot spot," controlled and logged in Excel


The small "hot spot" used for investigating gentle removal of skin growths (see earlier descriptions) has had yet another iteration. This version controls the Arduino from Excel, which also gets back data to log. Both the "hot spot" program, and the Excel control program are included in the download. Tuning the PID brought me face to face with the competing (and somewhat impossible) requirements of a quick rise time, together with minimum overshoot. I learned the hard way that you can end up with a "lock on" with certain combinations of heater and PID settings. That means, if you were going to put this device on skin, it should only be yours, unless exhaustive testing proved the stability. I believe a custom algorithm, "bang bang" based, in conjunction with a lookup table of PWM values may be a safer way to go.
Because different parts of the body will absorb, and dissipate, heat differently, the next stage of this project is to develop a quick test on which treatment time can be based. Now, this will be a very difficult area, but I will be pleased if I can lift current methodology just a little above the "black art" of a squirt of liquid nitrogen from a can!
PLEASE READ THE WARNINGS ASSOCIATED WITH THIS PROJECT EARLIER ON PAGE
Note, 2023. You MUST first load and register sCOMM32 from https://comm32.axcol.com/ BUT, the Excel book above requires V8 of sCOMM32, and V9 is now supplied. You will have to delete sCOMM32 from 'form I VBA, replace with new sCOMM32 after registering it in VBA if you do not have V8.
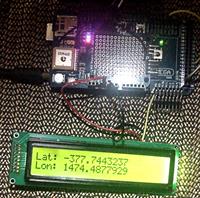
PROJECT: Running the Tinysine GPS Logger shield on the Arduino Mega, even though the advertisements do say "NOT FOR MEGA"
The advertisements for the old (v1r3) and new (V2) versions of the Tinysine GPS Logger shield stated "Not for Mega" It meant this handy shield had to be sidelined when any larger, more adventurous projects were to hand. The reason was that the Mega did not support the elected Software Serial ports. Even using the Hardware Serial would not work.
The workaround is simple, (even if it took hours to work out!) and beats fiddling the library.
Tested on a V1r3 shield.
1. Use the TinyGPS library. (I did not verify on TinyGPSPLus lib)
2. In your sketch you MUST nominate Ports 7 and 8 as INPUTS
3. Check the shield switch is set to Software Serial.
4. Use "SoftwareSerial mySerial(51, 52);" Or use other SS ports available on Mega
5. Loop a pair of wires to connect D8 to D51, D7 to D52
That's it!
To get the SD to work on this shield, Pin 10, NOT pin 53 is declared output
Use SD.begin(10, 11, 12, 13), per Adafruit SD library
I have now verified this hack using the Adafruit GPS library.
The download example provided is the Adafruit GPS library example "shield_sdlog"
modified as above, (and may I record my grateful appreciation of the service this company provides.)
PROJECT: MLX90614 Color mapped thermal detection of overheated components.
This project was used to detect overheated components on old circuit boards associated with repairing vintage Tektronix test equipment. Thermal scanning is a great assistance in locating leaky capacitors, and the old 1960 equipment have many. This does basically what common hand held thermal detectors do, easily pinpoints components lying close together, and incorporates a mapped temperature display. MLX90614 has a custom made cover 10mm long, with a drilled 3.2mm hole.
Basically this project was an excuse to explore mapping temperatures to a color and exploring sensitivity through a restricted aperture (Greatly reduced, even with a 3.2mm aperture).
Color temperature maps were a new field to me, and I was glad to base my development on Peter Kovesi’s material at http://peterkovesi.com/projects/colourmaps/ I used csv mapping files from that site, and incorporated the following three in this program for experiment.
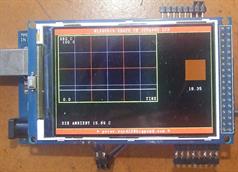
MLX90614 temperature is displayed as a running graph, and as a mapped color on screen patch.
“linear_ternary-red_0-50_c52_n256”
“rainbow_bgyr_35-85_c73_n256”
“linear_bmy_10-95_c78_n256”
Map illustrations above are from Peter Kovesi’s page, files are found there within “CETperceptual_csv_0_255.zip”
I am still exploring why my display colors are not closely following the map!
I am still exploring why my display colors are not closely following the map!
Your selected temperature range, eg. 10 to 80 degC, is mapped from 0 to 255, being the number of colors in each map.
Because of the greatly reduced sensitivity when using small tubular apertures, you may be better to explore using the Due
with 12 bit adc.
Because of the greatly reduced sensitivity when using small tubular apertures, you may be better to explore using the Due
with 12 bit adc.
This version was the proving test bed, used the Motor Driver Shield V1.0, and uses the 28BYJ-48 geared steppers modified for four wire operation by removing the plastic cap, cutting the center tap joiner trace and removing the red wire. Perhaps useful as the basis for a possible school Pyranometer project!
PROJECT: The ARDUPUS, an Arduino based Octopus tester. ("Goodbye Octopus, Hello Ardupus")
A breath of new life for a classic piece of test gear. The “Octopus” X-Y component tester morphs into the ARDUPUS
Dispensing with the oscilloscope, ac power supply, and all those wires, the Ardupus does all that the Octopus did, and more. Free standing, easy to build, and with more features than your old Octopus, the Ardupus breathes new life into this timeless piece of test equipment.
Presented here in several forms, the choicest being the dual window version, giving side by side signatures of componetry. Simpler, Mega based versions are included, and offer a simpler Ardupus, but still a vast improvement on the old ac powered Octopus. Full construction notes and simulations are on an accompanying pdf.
A "scope mode" included in each build allows easy determination of parameters, allowing for your variations in build. Electronics sit on a Proto Shield between Arduino and Screen.
This project will not disappoint.
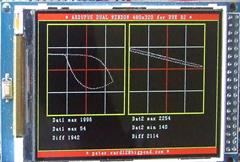
Above, Due based "Ardupus" gives side by side signatures, frees you of an oscilloscope and ac power supply as
needed in the traditional "Octopus"
needed in the traditional "Octopus"

Arduino "octopus tester" (Ardupus)working in dual trace overlay mode.
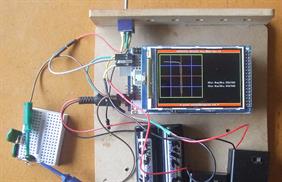
Most models include pots for trace shift and gain, but I include a very simple build, that operates with a fixed window. Not as easy to set up as pot versions, but has a smaller footprint.
PROJECT: A light sequencing color mixer for microscopy. A novel concept
This project extends the color mixing concept, already used commercially, a little further, by microprocessor (Arduino) control of a number of LED’s, switching start time and duration independently within a repeating time frame. The human eye, with its persistence of vision, can be tricked into seeing the specimen as lighted quite differently to normally mixed colors.
A suitable time window of 40 to 200 mSec, is chosen, and each individual color is adjusted for start time and on time within the window, which is repeated continually. Colours may overlap, and may include UV
Different and unique visual effects can be had by adjusting combinations of lighting, duration, mixes, sequencing, and positioning of narrow beam LEDs using sets of "Helping Hands".
Two build versions,with comprehensive notes, are included in the accompanying file. One build uses pots to control color start and duration times, the other uses an Universal TV Remote to set the parameters.
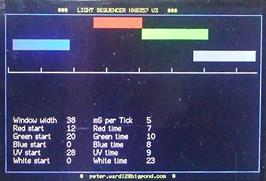
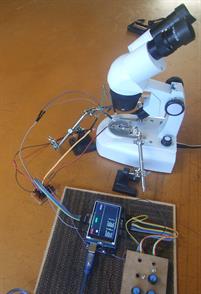
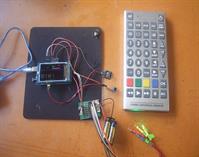
Left: This unique project sets any combination of color sequence or overlap timings for four color of LEDs.
Here I use red, green, blue, and UV
Here I use red, green, blue, and UV
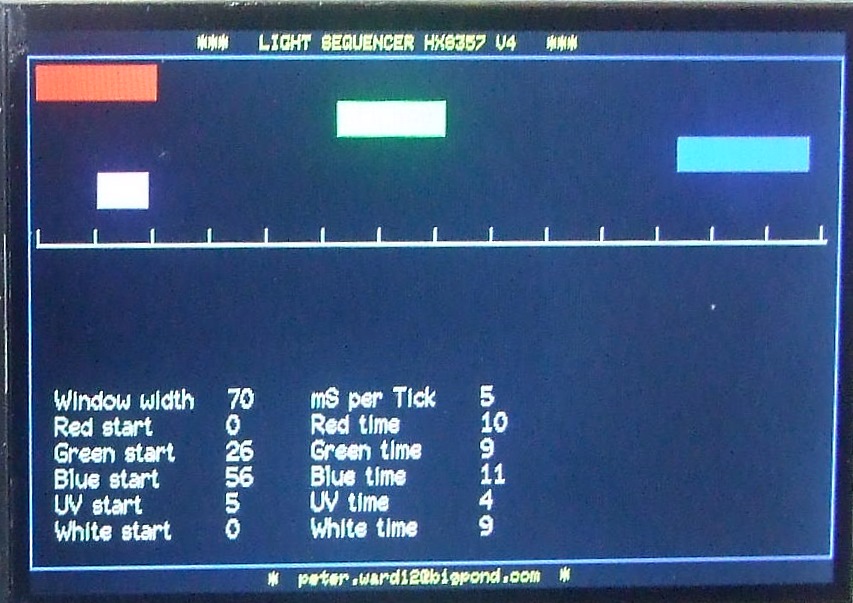
Left, a combination of colors and timings I found suitable for examining specimens with clear crystalline features, eg., nettle spines

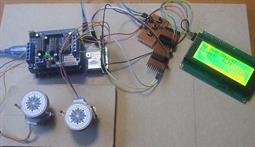

Tracking the sun mathematically may be superior to the normal sensor type trackers, but before you launch into a complex build, be aware that after considering expense, ongoing maintenance, and efficiency gains using two axis tracking, in most situations may be a better solution to just add extra fixed panels! Consider this solution in limited space situations only!
Pot controlled, light sequencing color mixer uses four LEDs of different colors. Include UV if you wish
Light sequencing color mixer controlled by Universal TV Remote.
Using the HC-12 Wireless Serial module with Arduino. AVOIDING the RESET TRAP
When using these modules for longer distance applications, we usually run these modules at a slower baudrate than the default 9600. It has been suggested that a small external program, available on the Internet, be run on your PC to set these modules as wanted.
All will be fine until you later connect the module SET pin to your Arduino, which you may do if, say, you intend to change the HC-12power settings or channels “on the fly”
If the HC-12 then finds the SET pin LOW on bootup, WHICH IT RANDOMLY DOES, it will reset the module to the defaults (9600, etc). A headache for you to diagnose if you have to disconnect and check the modules on an external program.
To avoid this problem it is essential, if using the SET pin, to include a complete setting routine, in your setup code, which will step through and test serial comms and if necessary reset to required speed.
Here is a suitable code to include. Unfortunately, it is a time consuming function, as I have allowed 1000 millis to enable command changes to become active. This is to be safe, as I found more than 700 millis wait time was needed in some cases.
Code operates by addressing the module at increasing baud rates ( 1200, 2400, 4800, and 9600) until it gets the “OK” response from the HC-12.
If the rate found is not as wanted, the code then sets it accordingly. Power and channel are also reset.

Above. The HC12 will reset to defaults if the SET pin goes low during bootup
This Arduino DUE implementation displays twenty four hours of particulate data using a Plantower sensor, which
has accuracy, stability (thermal and age), and split detection ranges that the GP2Y1010AU or PPD42S do not offer.
The day's data (240 six minute bins) is shown on a 320x480 display. The previous week's data is stored, so you can step back
and review "this day a week ago"
Also, for any day you can choose to view the 0.3-1.0um, 1.0-2.5um, 2.5-10um, or total particulate counts.
The "PMS" lib for Plantower sensors makes the use of these sensors easy. ( https://github.com/fu-hsi/PMS )
My frustration with this project has been an undiscovered interrupt contention, not yet resolved, that means buttons
to change days and particulates displayed are now read by a sub-optimal method.
Arduino Particulate Monitor using Plantower PMS5003
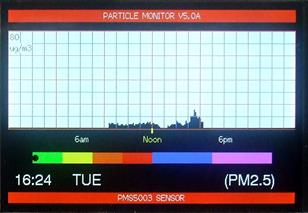
Right. Plantower PMS5003 can display averaged six minute blocks for a full day. Additionally, data can be stepped back over the past seven days for any of the three particle groups logged.
The bar displays the current particle level on a color grade as per application notes.
The bar displays the current particle level on a color grade as per application notes.
Arduino Particulate Monitor using DSM501A
Despite the confirmed superiority and accuracy of the Plantower sensors, I find the DSM501 cheap and responsive, even though only >1um particle size is reported. These are read differently to the Plantower, using "low pulse occupancy" over a unit time.
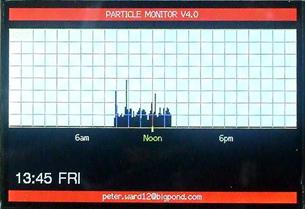
Left. DSM501A display shows average count of particles > 1um, averaged for a six minute block. The peak counts coincide with door opening and walkthrough.

Download file now contains improved, fully constrained bar display for GY-80
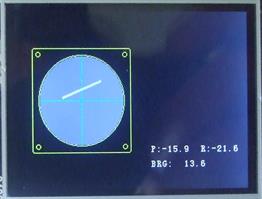
Logic Analyzer, very simple to build.

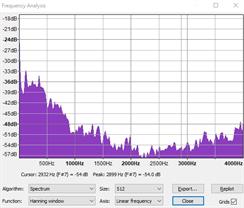
Above:-Audacity display of Arduino Due Audio Recorder waveform.
Right:- Spectrum display of the Arduino Due Audio Recorder
Used Transcend 2GB SD on 2.4"TFT 240x320 V2.1 shield. Same code run on HX8357B SD shield gave noticable sound glitches during card writes.
Right:- Spectrum display of the Arduino Due Audio Recorder
Used Transcend 2GB SD on 2.4"TFT 240x320 V2.1 shield. Same code run on HX8357B SD shield gave noticable sound glitches during card writes.
GPS with COMPASS and audio NOTE TAKER
A GPS logger that can be paused, and voice note recorded, using a filename auto generated based on six figure coords and last two digits of POI.
This project displays UTM in large accented six figure coords for use with WGS84 1km grids, shows a 'return to home' bearing, gps altitude, and displays a compass with incorporated leveling bubble.
A project to assist when logging historical artifacts, weed mapping, and generally useful to hikers.
Created to provide a feature lacking on my Garmin 60csx , being the abiity to make an audio note at a POI. The large six figure coordinates suit those who search or hike using a UTM map
Created on the Arduino Due platform, this build uses a HX8357 shield with SD, whose pin arrangement required use of sdFat "software SPI". My SD would only record at "SPI_HALF_SPEED", and audio has tiny "stalls," corresponding to buffer writes.
There has been frustration with interrupts on Due platform. I chose to read all buttons on interrupt, as normal polling would have destroyed the ability to record audio. Regularly an interrupt has detached from the "Record" button, and a button stop failed, leaving recording to stop on the set timeout. Workaround was to detach interrupt on the "Record" button when entering recording mode, and read a second analog pin whilst the audio was sampling every 125uS. This pin was looped to the interrupt pin. Prior to entering recording mode, normal interrupt is used, and whilst recording, analog value is used. Fast ADCreads,aprox 1.2 uS include write to var, mean the recording stop button is read every 125uS when each audio sample is taken. Header and comments in the Arduino file contain full build details.
Uses V.KEL VK16U6 GPS module, and GY-951, which takes all the frustration from compass calcs.
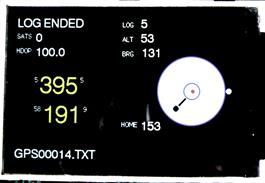
Features GPS logging, display of large six figure coordinates,and compass. When paused, a voice note can be recorded. Compass also returns a bearing to home.
Controlled by only three buttons,which toggle. Log/End, Pause/Resume, and Record/Stop
Controlled by only three buttons,which toggle. Log/End, Pause/Resume, and Record/Stop
Accounting for spray usage is moved from operator compiled logs to an automated system that accounts exactly for all spray applications, and logs in a form that can be easily used to produce map overlays.
With Local Government conscious of the amount of successful lawsuits related to the use of popular weedicides, best practice in spray logging moves the recording from operator entered sheets to an automated process. With this system, every time the spray applicator presses and then releases the trigger on the spray gun, the volume delivered is written to SD card, together with a gps and date-time stamp.
This is a completed project for the automatic logging of every spray application, developed on Arduino, using “off the shelf” components. Prototypes are built and software proved
THE CONCEPT
A transmit box is mounted on the spray trailer, with a flow sensor mounted in the delivery line. A 433 MHz transmitter working in the ISM band will send flow detail to a receiver accompanying the spray applicator, who may be operating up to 100m away from the spray trailer in some cases.
When the software at the trailer end senses a flow beginning, it starts to tally the pulses from the flow meter.
When the flow stops, it transmits the pulse tally, which is received at the operator end, and automatically appended to GPS location data. (Equally, the logging could occur at the trailer end, after receiving GPS coords back from the operator end, but power consumtion would mean more battery charges/changes)
Saved to SD, the data can later be processed in Excel, and overlay maps produced with every application of spray shown.
As required, a button is pressed on receiver unit, which toggles through spray mix ID numbers appended to logged data to indicate which active ingredient is being used.
Once the file is imported to Excel, the operator can convert mix volume to actual active ingredient used at any location.
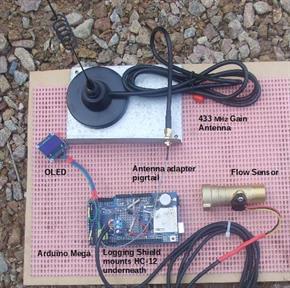

Spray Logger, Spray cart mounted sender, proto.
Spray Logger, operator's 'Bum Bag' mounted receiver with gps, proto. Accompanying notes offer an alternative 'Mega Pro Mini' build, which is substantially smaller than the proto.
Automated Spray Logger, companion to Weed Mapper
'Colloidal' Silver TDS monitor and control
Uses a TDS sensor to monitor an ‘Ionic Silver’ generator, which requires a switch off at a nominated ppm. A simple to use, calibratable probe, is used to monitor TDS using a multiplication factor of two to obtain ionic silver ppm from meter ppm.
To be clear, ppm based on ionic measurement has no direct relation to colloids in solution. All process control based on TDS monitoring can do is give you repeatability of outcome based on ionic concentration. The presence of micro/nano silver particles, colloids, is not directly proportional to ions generated. Different process’, temperatures, uV/blue spectrum levels generate different ratios of ions and colloids. A low voltage DC generator will produce mostly ions, a spark process will produce more particulates. Only lab analysis can quantify the level of colloids produced by any given process. Accompanying PDF expands detail, explains use of UV in process
To be clear, ppm based on ionic measurement has no direct relation to colloids in solution. All process control based on TDS monitoring can do is give you repeatability of outcome based on ionic concentration. The presence of micro/nano silver particles, colloids, is not directly proportional to ions generated. Different process’, temperatures, uV/blue spectrum levels generate different ratios of ions and colloids. A low voltage DC generator will produce mostly ions, a spark process will produce more particulates. Only lab analysis can quantify the level of colloids produced by any given process. Accompanying PDF expands detail, explains use of UV in process
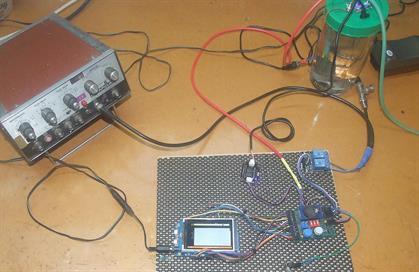
Left. Silver process is monitored for ppm and temperature. Stirring is by air trickled from aquarium pump, Generator swings +/-20v at 100 Hertz
.
Below: Screen has progress bar and bar graph updates every three minutes. Small control board has RTC, start button and set pot for cut off.
.
Below: Screen has progress bar and bar graph updates every three minutes. Small control board has RTC, start button and set pot for cut off.

Arduino Distributor Dwell Centrifugal Advance Plotter
An unusual application of the Arduino pulseIn() function.
It was important to verify the centrifugal advance curve on Chinese sourced after-market distributors. (Experience with my antenna work has proved that just because a Chinese antenna looks the part, there is NO reason to believe it will function as described!)
At 3000 spindle revs, we are talking 55 uS per degree, and every attempt to use micros() or available custom libraries to record intervals gave erratic results. Input capture on Mega has some caveats, so I looked for an alternative solution.
Rpm was easy, use pulseIn(). Jjust tallying time for on (reflective strip) duration, adding to off time ( balance of a rotation)
But how to use pulseIn() to record a pulse that was triggered by sensor on rotor, stopped by sensor on spindle, with minimum overheads?
Simple! But I confess to holding my breath when first trying this one!
1. Choose a vacant pin, “anyPIN”.
2. Declare as output. pinMode(anyPIN,OUTPUT)
3. rotor ISR()
{digitalWriteFast,anyPIN,HIGH }
4. spindle ISR()
{digitalWriteFast,anyPIN,LOW }
5.Time between high and low triggers is now given by T= pulseIn(anyPIN,HIGH)
You may average a couple of rotations, but I found the results very stable, with just a little jitter that could be removed by averageing and a vibration reducing sleeve on coupling.
Once knowing time for one rotation, and time between rotor and spindle triggers, we can set the offset at 400 engine rpm to zero, and plot the relative advance as revs increase.
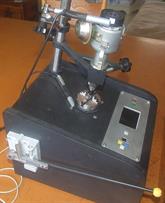

Centrifugal advance curve shows some problems , possibly caused by unmatched spring pairs
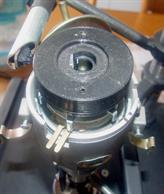

Centrifugal advance is mapped by spinning with a 500w Chinese industrial sewing machine servo motor kit adapted to a small three jaw chuck. The two 'DFRobot Line Tracking sensors' are mounted on adjustable arms
Rotor button is replaced with 3D printed rotor with reflective strip. 'DFRobot Line Tracking sensor' mounts on location arm. The rotor was made in two parts, with locating holes every 15 deg. Using the setup and diagnostic button, accuracy was checked
Distributor Centrifugal Advance Plotting Bench.
(Direct clamping of spindle is not a good idea, needs a soft clamp. Working on it.)
(Direct clamping of spindle is not a good idea, needs a soft clamp. Working on it.)
Menu includes a test mode where all timing values are displayed to quickly display a triggering problem. SD card save included, with a custom Excel spreadsheet to auto import the file for printing (not included in download)
Now head over to the IOT tab, find lots more projects there.
And the latest now on CURRENT tab
And the latest now on CURRENT tab
. The reason for the pause in project is I intend to abandon servos and use steppers or mini servos as far more reliable and more finely controllable as needed to extend build for ten speed.
Fix page not displaying correctly (Text splashing) in Firefox:-
Firefox - Settings - Font - Advanced. Check " Allow pages to select their own fonts"
Firefox - Settings - Font - Advanced. Check " Allow pages to select their own fonts"
UNIQUE AND ADVANCED ARDUINO PROJECTS
Deek Robot data logging shield
Arduino Mega 2650 matched with datalogging shield and 16x2 LCD keypad.
Above: Excel recieves data from a remote sensor, whose orientation can be varied by joystick attached to 'passthrough' Arduino Mega
Above: Remote sensor is on a x/y platform controlled by two servos. These receive instructions from a joystick attached to the Arduino mega passthrough, Sensor data goes back through passthrough to Excel
Above: Miniature hotplate settings, times, and cycles are set by keyboard talking to Arduino via Bluetooth shield
Temperature cycles of the heated ceramic resistor are
plotted visually.
plotted visually.
Above: Seed hopper has IR sensor to warn when contents are low
Above: "not for mega" Tinysine shield is simply adapted for use on Arduino Mega.
Arduino controlled Ionic silver generator cannot guarantee you are producing only silver ions, or of an absolute value.
This setup only ensures repeatability of your product.
This setup only ensures repeatability of your product.